CALIPR: Malawi Agriculture Data Exploration
Optimising the use of crop residues for Conservation Agriculture and Livestock Production in Malawi
Overview
- Project Length - 3 months
- CEMAC Output - Creation of an interactive data exploration app with R-Shiny
- Funding Body - UKRI
- Website - https://cemac.shinyapps.io/CALiPr/
Introduction
The CALiPr-Malawi project (Optimising the use of crop residues for Conservation Agriculture and Livestock Production in Malawi) was a short term QR GCRF project which endeavoured to investigate sustainable agriculture practices in Malawi. A part of this was the collection of data from many farmsteads over the north an
d central regions of Malawi.
The job of CEMAC in this project was to take this data, originally in an anonymised csv file with more than 50 data fields and observations of over 2000 different farmsteads, and present it in a way that a researcher could assess at a glance:
- how many farms grew specific crops
- how many farms used sustainable agricultural practices
- how agricultural practices tracked with level of education of the principal farmer
This would enable the project PI to identify an appropriate sample of farms for soil sample collection
R-Shiny
R-Shiny was used to create the data exploration app. This is an add-on to the statistical programming language R, which allows interactive apps to be built. R-Shiny is especially good for users who are unfamiliar with CSS, as it allows the formatting to be abstracted away, and interfaces with Javascript natively, or with the shinyjs library. Packages used in the CALiPr app included:
- Bootstrap for dashboard layouts
- plotly for interactive plotting
- Leaflet for interactive mapping
among many others. R-Shiny apps can be deployed directly to shinyapps.io to create web based data exploration apps, as was done for this project.
CALiPr Shiny App
Like all web apps, the R-Shiny app divided into a back-end where all the computation is carried out, and a front-end, which is what the user sees. Any elements of the front end that are controlled by logic such as hidden buttons are determined on the back end also.
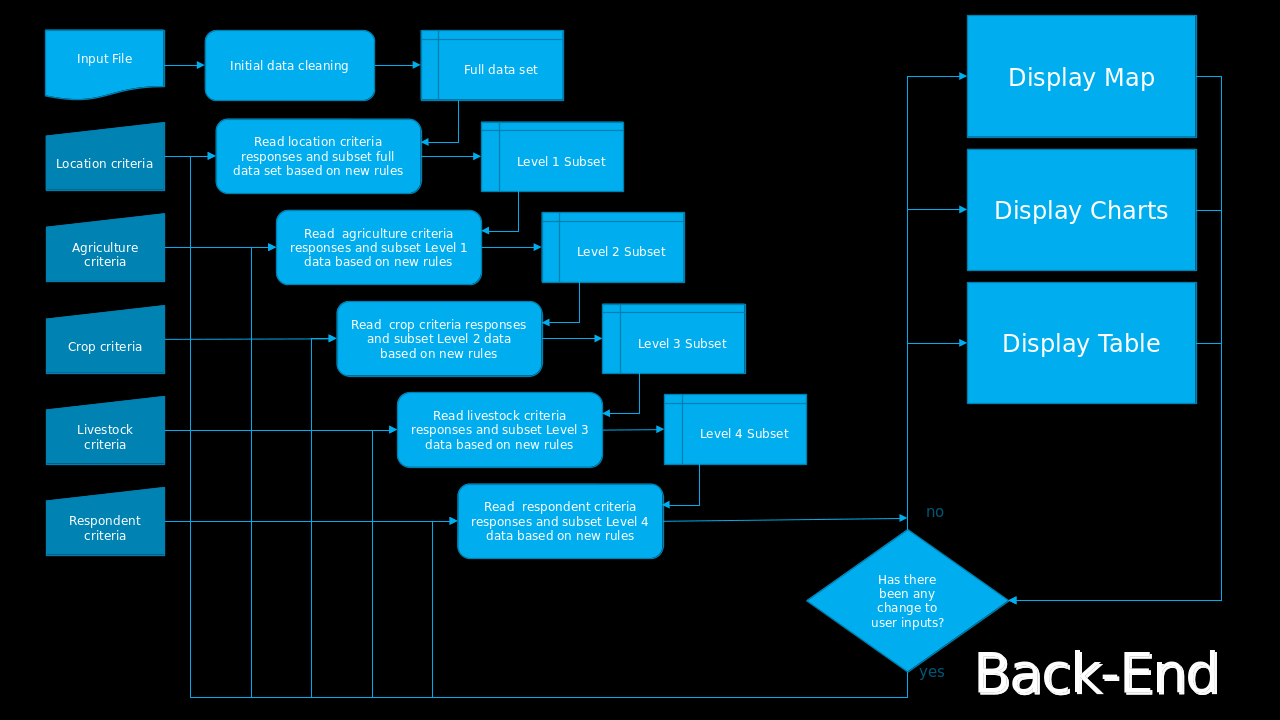
Back End
The back-end of the site works by running a recursive five-level subsetting process, selecting only that data which complies with the criteria selected by the user and reacting to any changes to the selection criteria. For data security, the survey file must exist on the computer used to access the web app and be uploaded at the time of use.
Front-End
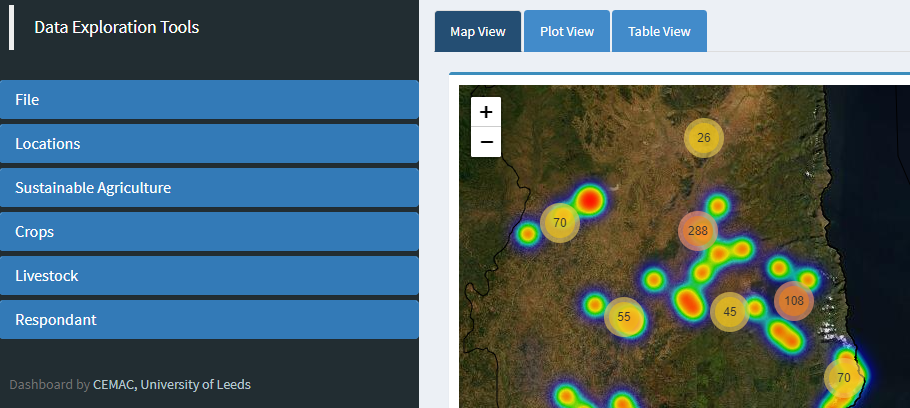
The farms selected through the data subsetting process are shown to the user on a Leaflet map as both heat maps and cluster points as shown below. Clicking on a cluster zooms in on the area encompassed by that cluster and shows data again as heat maps and clusters, with the original cluster breaking up into multiple smaller clusters.
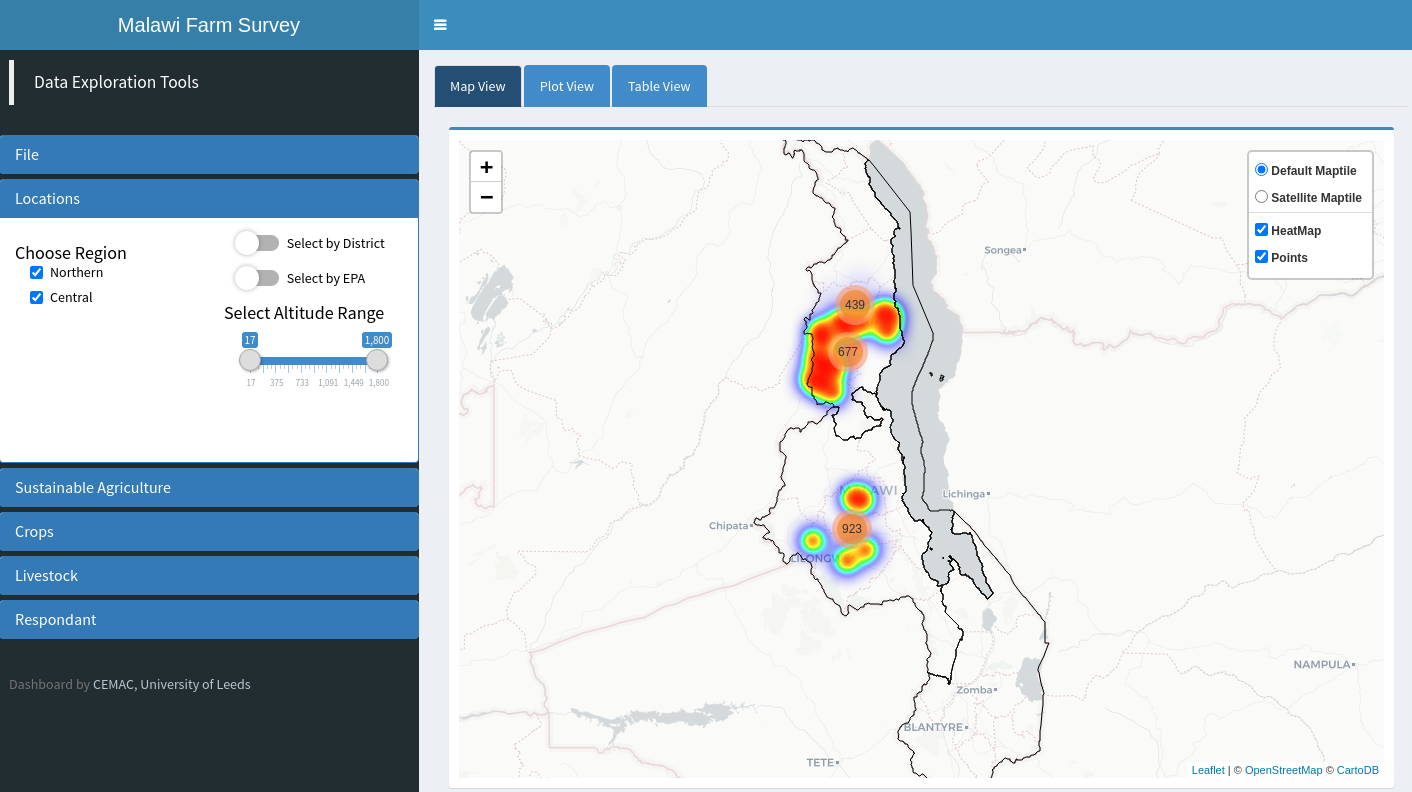
Full data set over Northern and Central Malawi showing selected farms as both clusters and heat maps
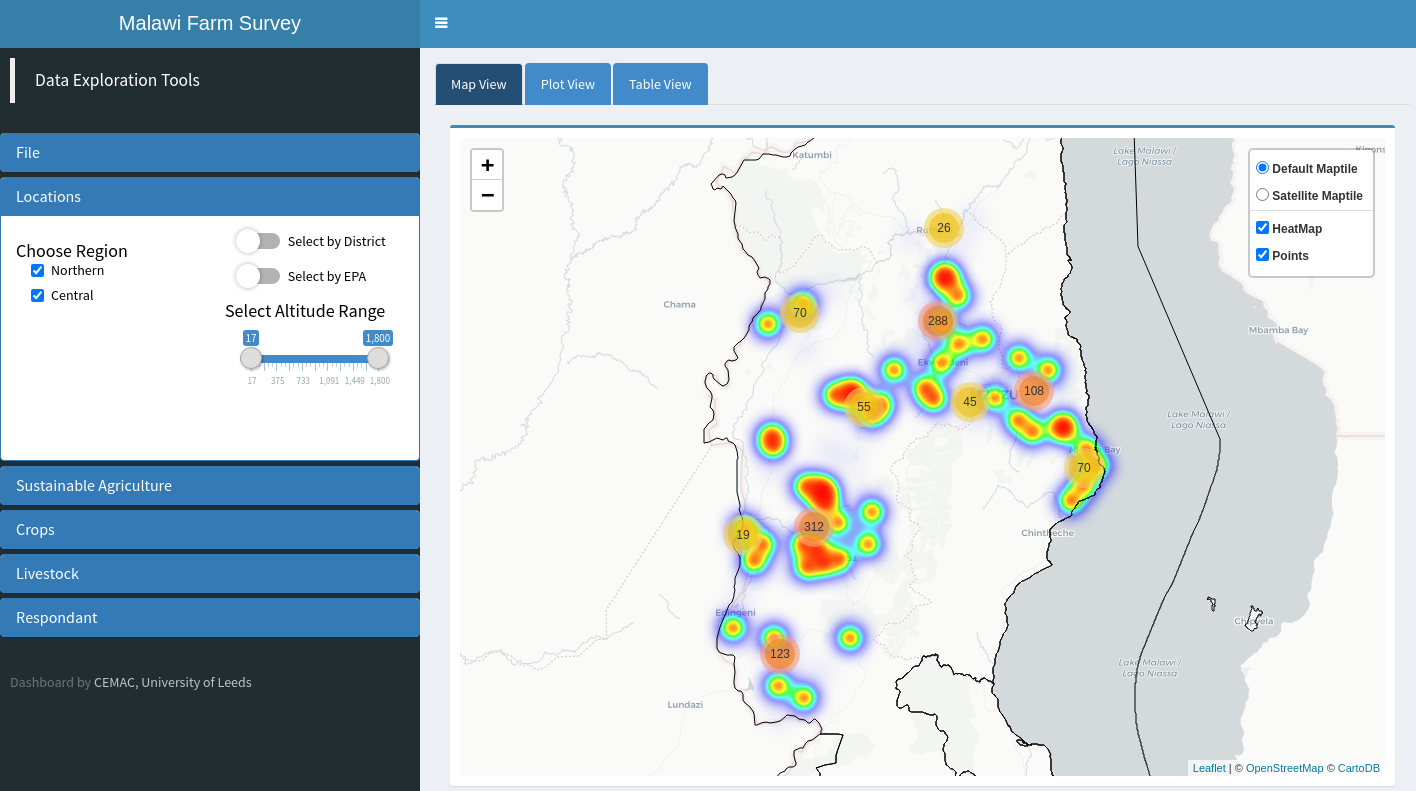
Zoomed in data over Northern Malawi, from clicking on a cluster to expand into smaller clusters
The data selection process is carried out through collapsible panels on the left, with each of the panels relating to a different section of the raw data. To make data selection easier, on many of the panels there are optional mini-graphs, which are made using plotly.
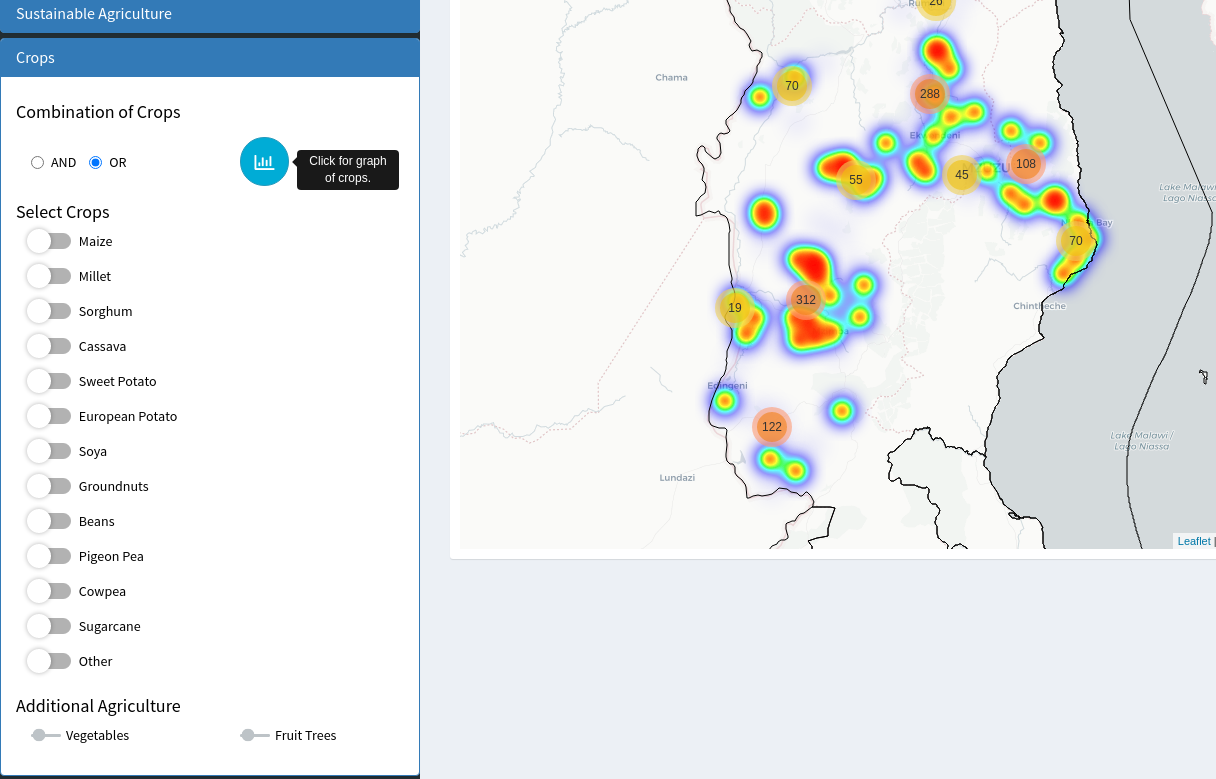
The button for showing the mini graphs is shown along with the hover text instructing the user to click to show the graph
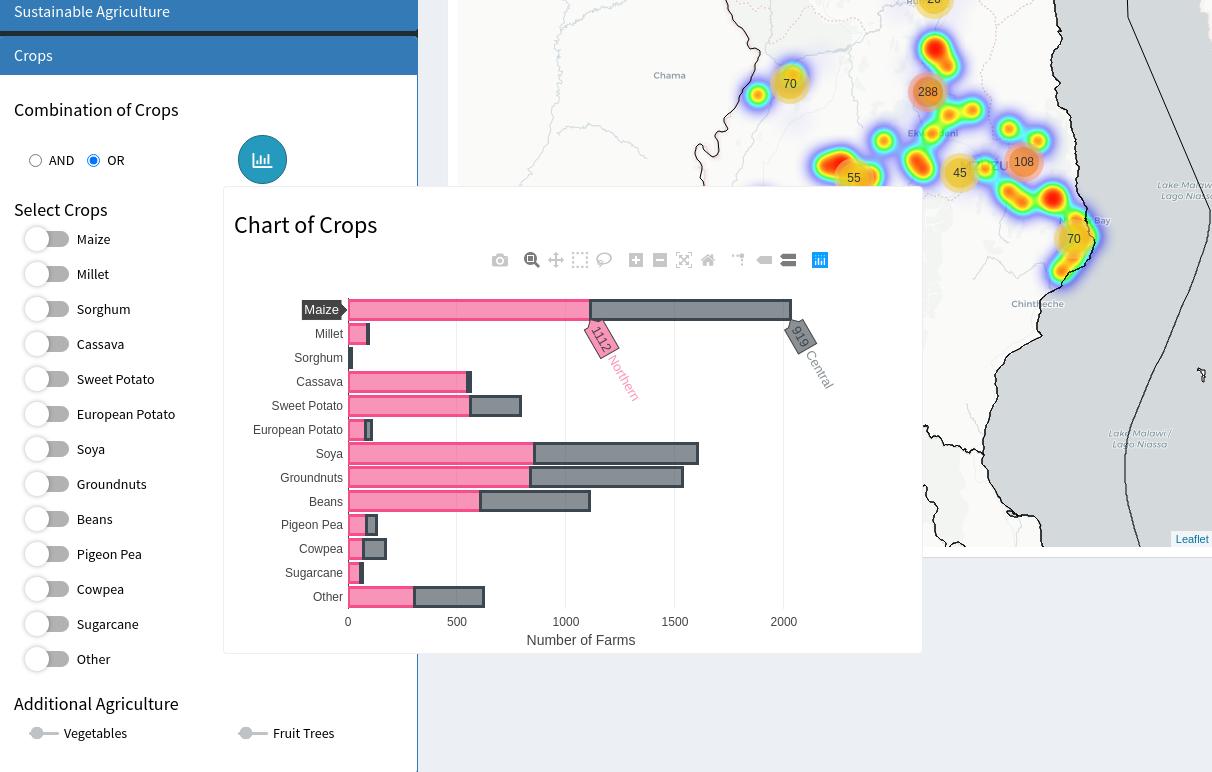
Mini-graph shown, comparing the numbers of farms which grow each individual crop. Data for Northern and Central regions are separated.
The mini graph allows the user to see how imposing a particular criteria will affect the number of farms selected. For example, the user can see that sorghum is rarely grown anywhere, and that while cassava is grown widely in the Northern region, it is fairly scarce in the Central region. This allows the user to be more informed when choosing the selection criteria.
Once all criteria are chosen, a csv file of the selected data can be exported and used by the PI to make choices about soil sampling .